The aggressive brownout which invents the value from brownout of cost-saving
I write by the theme as wise brownout.Enthusiasm of brownout is falling from time just after the earthquake disaster practically.But surprisingly, it seems that the custom of the brownout acquired once doesn’t forgot and it seems fixed to shift from “endurance brownout”to”wise brownout”. In the enterprise which did “electric visualization”,the brownout is done naturally.
First, we will review about brownout here. In brounout, there are that which restrains a peak and that which reduces the daily whole electric power consumption.It’s necessary to classify this and wrestle.
Basically, “electric visualization’s” shows the power in lowering this peak demand. Besides, in the enterprise it’s important to have the consciousness of brownout every day,and so,the electric waste is decreasing.
However, really significant brownout lowers a peak of the electric power (careful.).
Actually, it’s often almost insignificant to lower to reduce the daily electric power consumption by brownout activity.
When here is mistaken, it becomes “endurance brown “and it’s painful.
For example, we are sometimes finding the elevator or escalator are thin worked in the building even now, that is inconvenient, but the real effect of the expectation
brownout is low comparatively.
The electric power consumption is originally only 2 or 3 % of the whole , even if we save electricity, there is no great meaning as power-saving effect.
At this rate, only dissatisfaction grows stronger.
A standby power requirement cut of an office automation also takes time and effort , the effect is light comparatively.It’s insignificant to measure the electric power consumption
every outlet.
It’s not uncommon that recent electrical appliances were very developed the measure of the standby power requirement and those were less than several watts.
Even if someone cut main source of electrical power the electrical outlet one by one, there is no compared effect.
To perform the brownout of the whole electric power consumption, as reconsideration of electric power equipment is often needed,you have to ascertain accurately the whole
electric power equipment For example,if saying by lighting, it’s exchange to LED light, .
(※But they may not always have the effect in case of an exchange to LED light, so, investigation and inspection according to the site are necessary.)
It becomes important to grasp what to use much electric consumption as the brownout measure.
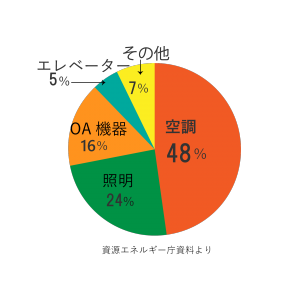
The sectoral electric power consumption of the time of the peak in summertime is graphed out here from material of Resources and Energy Agency.
An important one is to shift a peak. It isn’t peak cut.Endurance Brownout isn’t necessary.
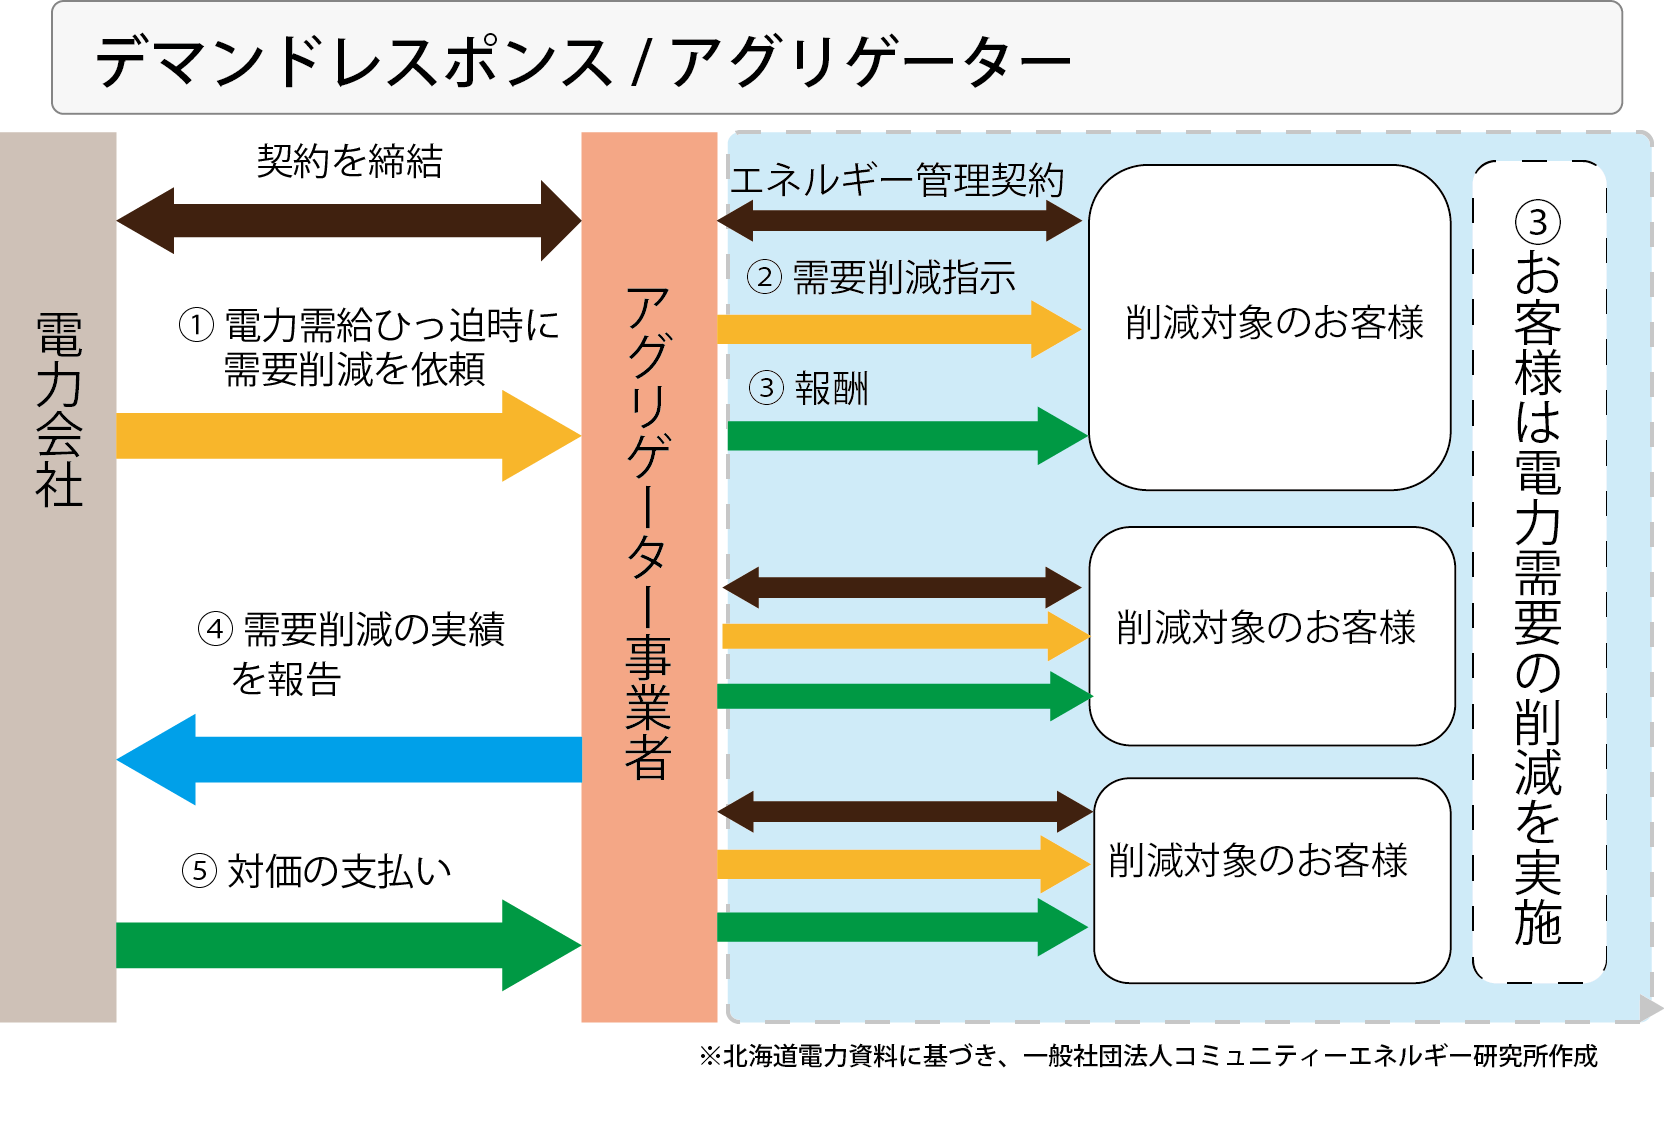
By the way, would you hear “Aggregator by the demand response” recently?
This is the movement that get profit more aggressively by not only to lower an electric basic charge by reducing a peak demand but also by using it for demand adjustment of an electric power system.
(Demand Aggregator recruitment of Hokkaido Electric Power)is the aggressive brownout which invents the value from brownout of cost-saving. About this, the special column, it’s being done to write it. About this, the special column, it’s being done to write it.
Office electric power
Office electric power
In the general office building, the electric power consumption in the daytime (9:00-17:00) is large, and it in night is about 30 %- 60 % compared with the daytime. And the percentage of the electric power consumption at the time of the peak is as follows that air conditioner is about 48 % and OA instrument is about 16% and lighting is about 24 % and those totals are about 88 % of the whole.
Read More