
About the feature and function of ODMS
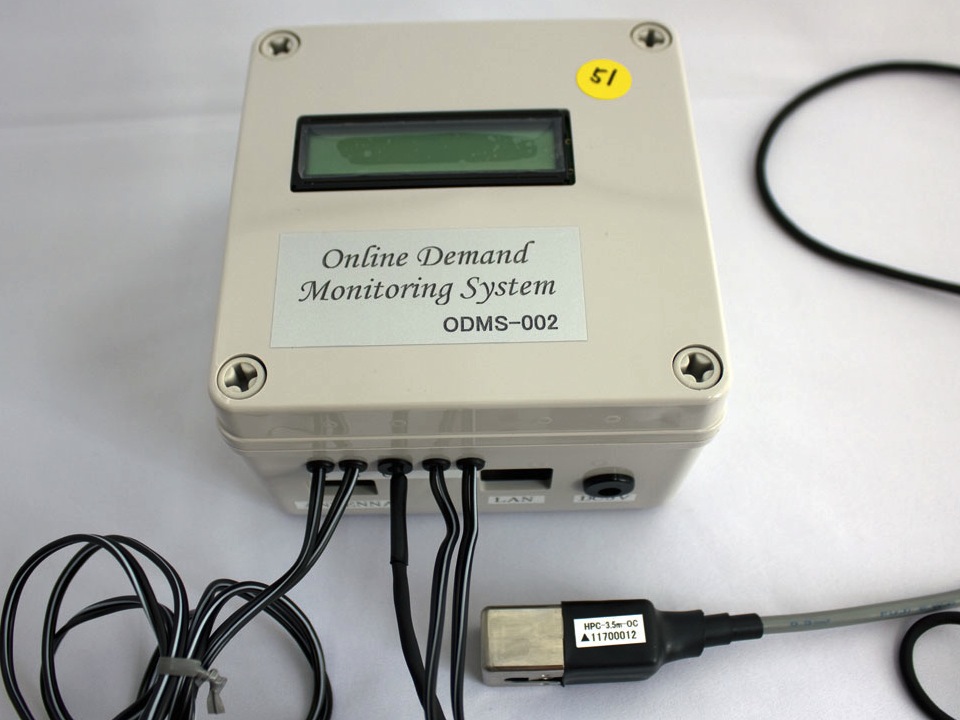
ODMS is visualizing system that graphs out the electric amount of consumption by every 1 minute.This is often called “electric visualization” in recent years. To be called “electric visualization”, we are thinking . to have to provide the following 3condition at least.
1.It’s graphed out in real time (every 1 minute).
2.It predicts a demand (between 30 minutes) and warns overuse.
3.It’s seen anytime and anywhere at a mobile end.
Of course,it requires the conspicuousness of a chart and also other various elements, but, anyway, if it isn’t data of every 1 minute period, that it becomes very difficult to use.
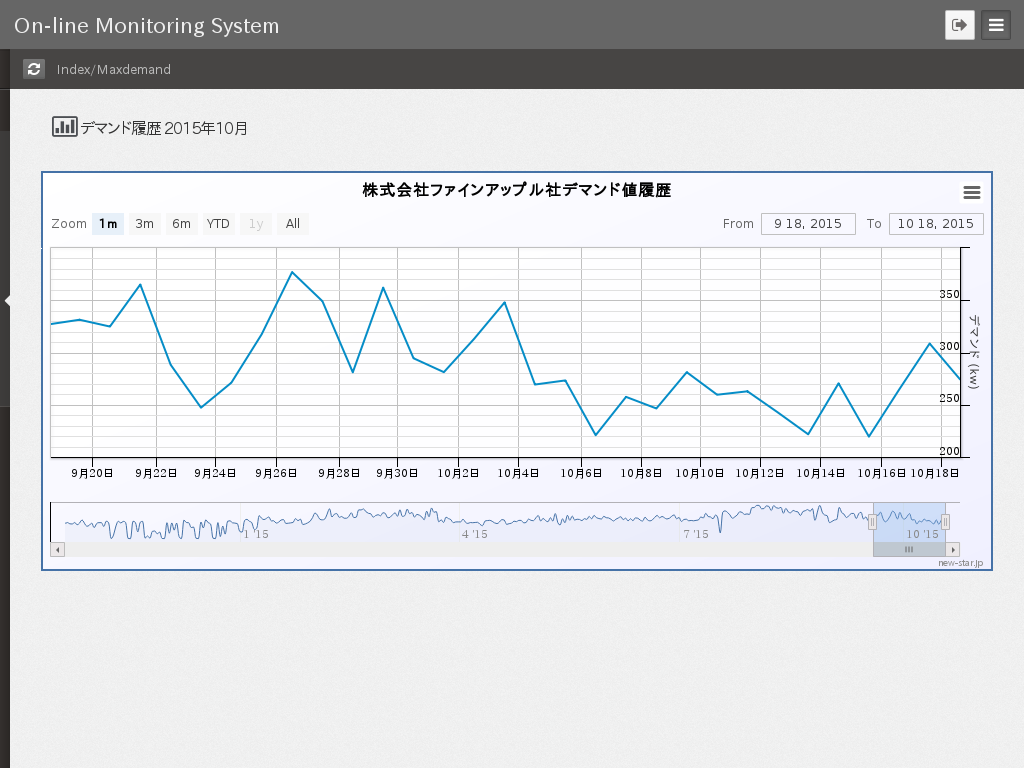
The next chart is a monitor chart by an instant demand of 1 minute unit
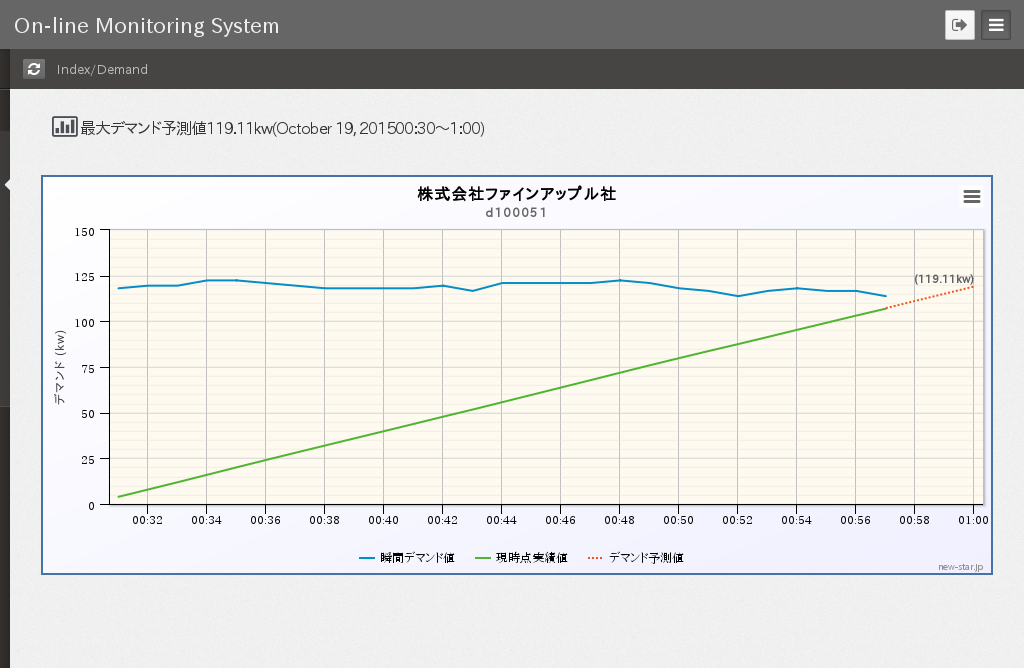
In the chart, a blue line shows the track of the demand for every 1 minute, and a green line shows the track of the demand for 30 minutes and a red line shows the prediction of the demand.
When a red line of this prediction exceeds an setting threshold beforehand, a warning signal by a mail and a contact signal are output.When this alarm was given, immediately, an air conditioner and machine will be stopped, it becomes possible to take measures that the peak demand is restrained.
Because it’s graphed by 1 minute unit, this is the behavior which becomes possible.The trick of the brownout is being seen by doing such behavior several times.”If a warning rings, it’s being shared as knowledge in the inside “of the company what kind of behavior to do.This is because behavior is urged by a warning and also can see electricity by a demand chart.
A demand goes over the threshould and later, even if see a chart, it isn’t easy for us that find the cause quickly.The moment a warning rang, when also seeing the chart in a moment, it’s OK.We become able to consider a measure better than the time when you looked back to the chart later.
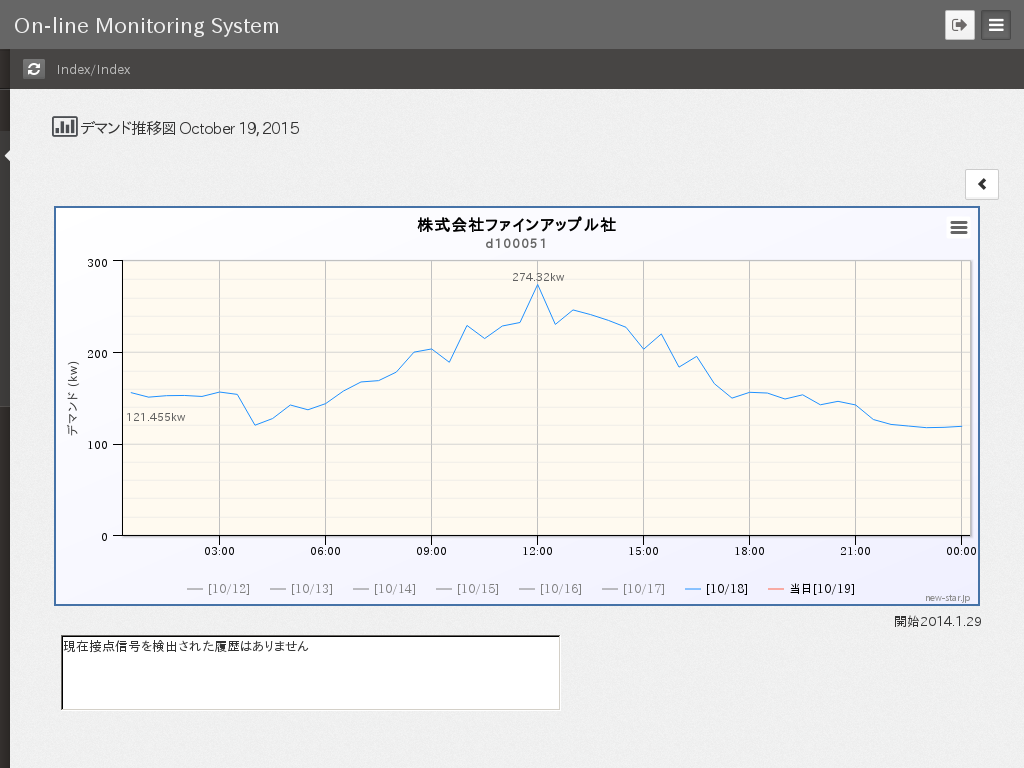
The next is a demand change figure.
1 day demand chart of 30 minute unit is piled up week in one lot(that the day is included, for 8 days) every 1 day by one click, and this is indicated on 1 screen.Electric power consumption for 1 week unit is often repeated the same behavior.
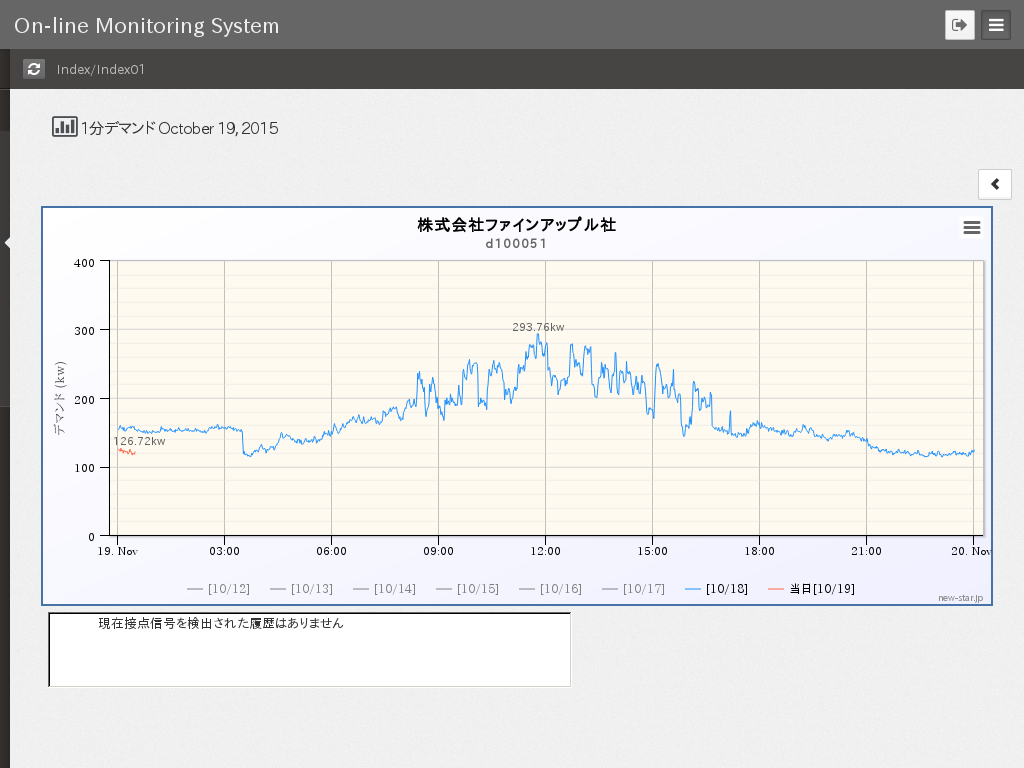
The next is a change chart of the instant demand of 1 minute unit.
The demand value history chart.
A demand peak in the past is recorded by a change figure of the demand peak every 1 day.
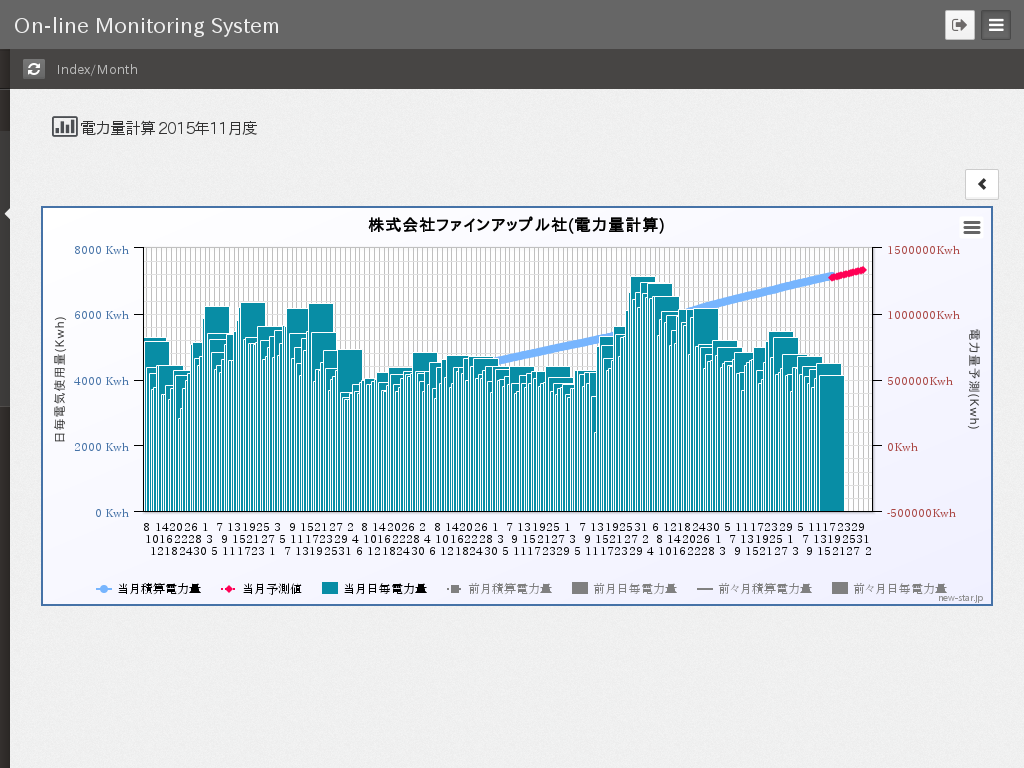
An amount of electric power history figure.
One month change figure of the electric power amount of consumption every one day.
A power rate chart.
A change figure of the electricity charges every one day.
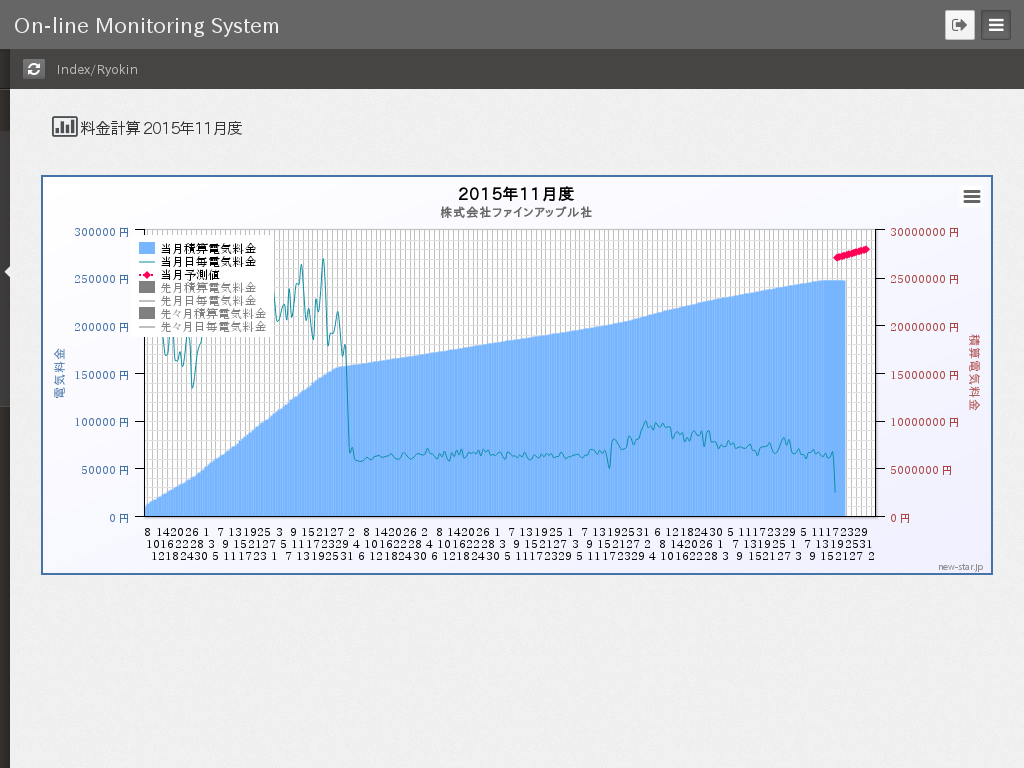
The electric amount of consumption is obvious and it isn’t necessary to explain such chart.It becomes able to lower a basic charge certainly by lowering a peak of a demand.
The effect of the actual brownout
Then, how much effect on brownout?
I’ll also put here the example which received information that had the effect using this system indeed.Here is described detailed of a usage example and it becomes conclusive in the following.
The demand reduction change figure Ifrom the ODMS user report
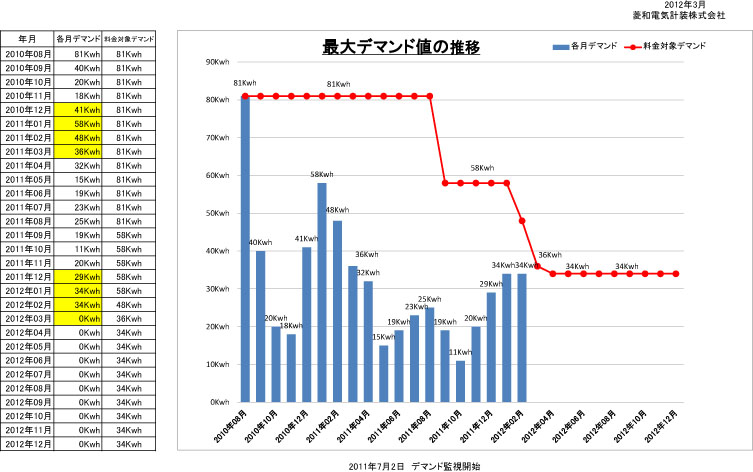
The data from which I received a contact, I have leave just as it is. It’s carried. (Thanks!)
Change in actual contract electric power and basic charge
(the contract electric power)
| The first | It’s renewed the 1st time | It’s renewed the 2nd time |
|---|---|---|
| 81KW | 58KW | 34KW |
| \107,163 | \76,734 | \44,982 |
The electric power cost which could reduce on the calculation only by a basic charge (It’s counted on an annual base.)
Finally, the cost of ▽\432,621 reduced annual base only by a basic charge.But, this is calculation only of a basic charge and actually there is reduction in more than \1,000,000 yen a year including the electric power amount of consumption and it’s continuing.
Did \432,000 a year seem little?But please remember that the contract electric power which is originally is a reduction base by the 81KW scale.If a company is the contract electric power of the 400KW, there is a possibility of the quintuple reduction.It’s 2,000,000 yen then readily only by a basic charge.
Now, ther is another important thing to discuss at the end.Reduction in basic charge of the electric power is decided about based on demand results.Therefore for example when recording the peak demand of 60KW in summertime, the contract electric power is set as 60KW.In this case, unless the demand is recorded less than this in next summertime, the contract electric power isn’t renewed.This doesn’t change even now.
How to decide the contract electric power in detail from the using electric
The figure in the site of Tokyo Electric Power is being quoted.But as shown in this figure,the maximum demand in the month is graduadual chart is little, I think.The difference between maximum and minimum demand is usually greater.
But it’s important from here.If you negotiate with the condition of this ODMS installation, the power company regards the electric power restraint by DR (demand response) and responds to
renewal of the contract electric power.
So an installation cost of ODMS aren’t the number of the thing. How about being considered?
