The aggressive brownout which invents the value from brownout of cost-saving
I write by the theme as wise brownout.Enthusiasm of brownout is falling from time just after the earthquake disaster practically.But surprisingly, it seems that the custom of the brownout acquired once doesn’t forgot and it seems fixed to shift from “endurance brownout”to”wise brownout”. In the enterprise which did “electric visualization”,the brownout is done naturally.
First, we will review about brownout here. In brounout, there are that which restrains a peak and that which reduces the daily whole electric power consumption.It’s necessary to classify this and wrestle.
Basically, “electric visualization’s” shows the power in lowering this peak demand. Besides, in the enterprise it’s important to have the consciousness of brownout every day,and so,the electric waste is decreasing.
However, really significant brownout lowers a peak of the electric power (careful.).
Actually, it’s often almost insignificant to lower to reduce the daily electric power consumption by brownout activity.
When here is mistaken, it becomes “endurance brown “and it’s painful.
For example, we are sometimes finding the elevator or escalator are thin worked in the building even now, that is inconvenient, but the real effect of the expectation
brownout is low comparatively.
The electric power consumption is originally only 2 or 3 % of the whole , even if we save electricity, there is no great meaning as power-saving effect.
At this rate, only dissatisfaction grows stronger.
A standby power requirement cut of an office automation also takes time and effort , the effect is light comparatively.It’s insignificant to measure the electric power consumption
every outlet.
It’s not uncommon that recent electrical appliances were very developed the measure of the standby power requirement and those were less than several watts.
Even if someone cut main source of electrical power the electrical outlet one by one, there is no compared effect.
To perform the brownout of the whole electric power consumption, as reconsideration of electric power equipment is often needed,you have to ascertain accurately the whole
electric power equipment For example,if saying by lighting, it’s exchange to LED light, .
(※But they may not always have the effect in case of an exchange to LED light, so, investigation and inspection according to the site are necessary.)
It becomes important to grasp what to use much electric consumption as the brownout measure.
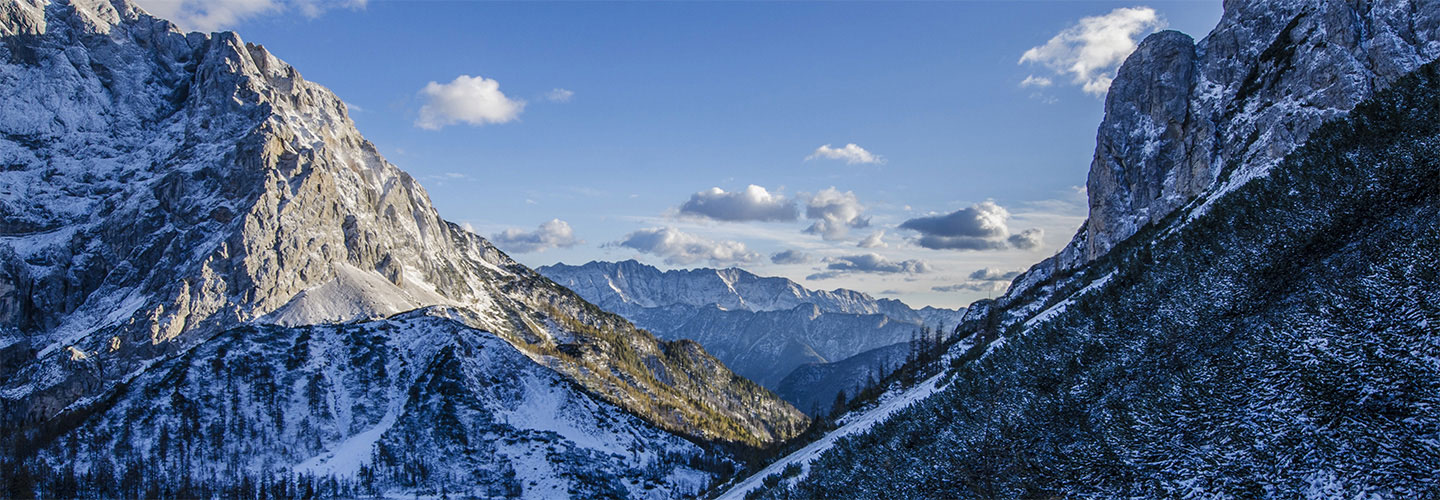
The sectoral electric power consumption of the time of the peak in summertime is graphed out here from material of Resources and Energy Agency.
An important one is to shift a peak. It isn’t peak cut.Endurance Brownout isn’t necessary.
By the way, would you hear “Aggregator by the demand response” recently?
This is the movement that get profit more aggressively by not only to lower an electric basic charge by reducing a peak demand but also by using it for demand adjustment of an electric power system.
(Demand Aggregator recruitment of Hokkaido Electric Power)is the aggressive brownout which invents the value from brownout of cost-saving. About this, the special column, it’s being done to write it. About this, the special column, it’s being done to write it.
Office electric power
Office electric power
In the general office building, the electric power consumption in the daytime (9:00-17:00) is large, and it in night is about 30 %- 60 % compared with the daytime. And the percentage of the electric power consumption at the time of the peak is as follows that air conditioner is about 48 % and OA instrument is about 16% and lighting is about 24 % and those totals are about 88 % of the whole.
Wholesale retail electric power consumption graph
Wholesale retail electric power consumption graph
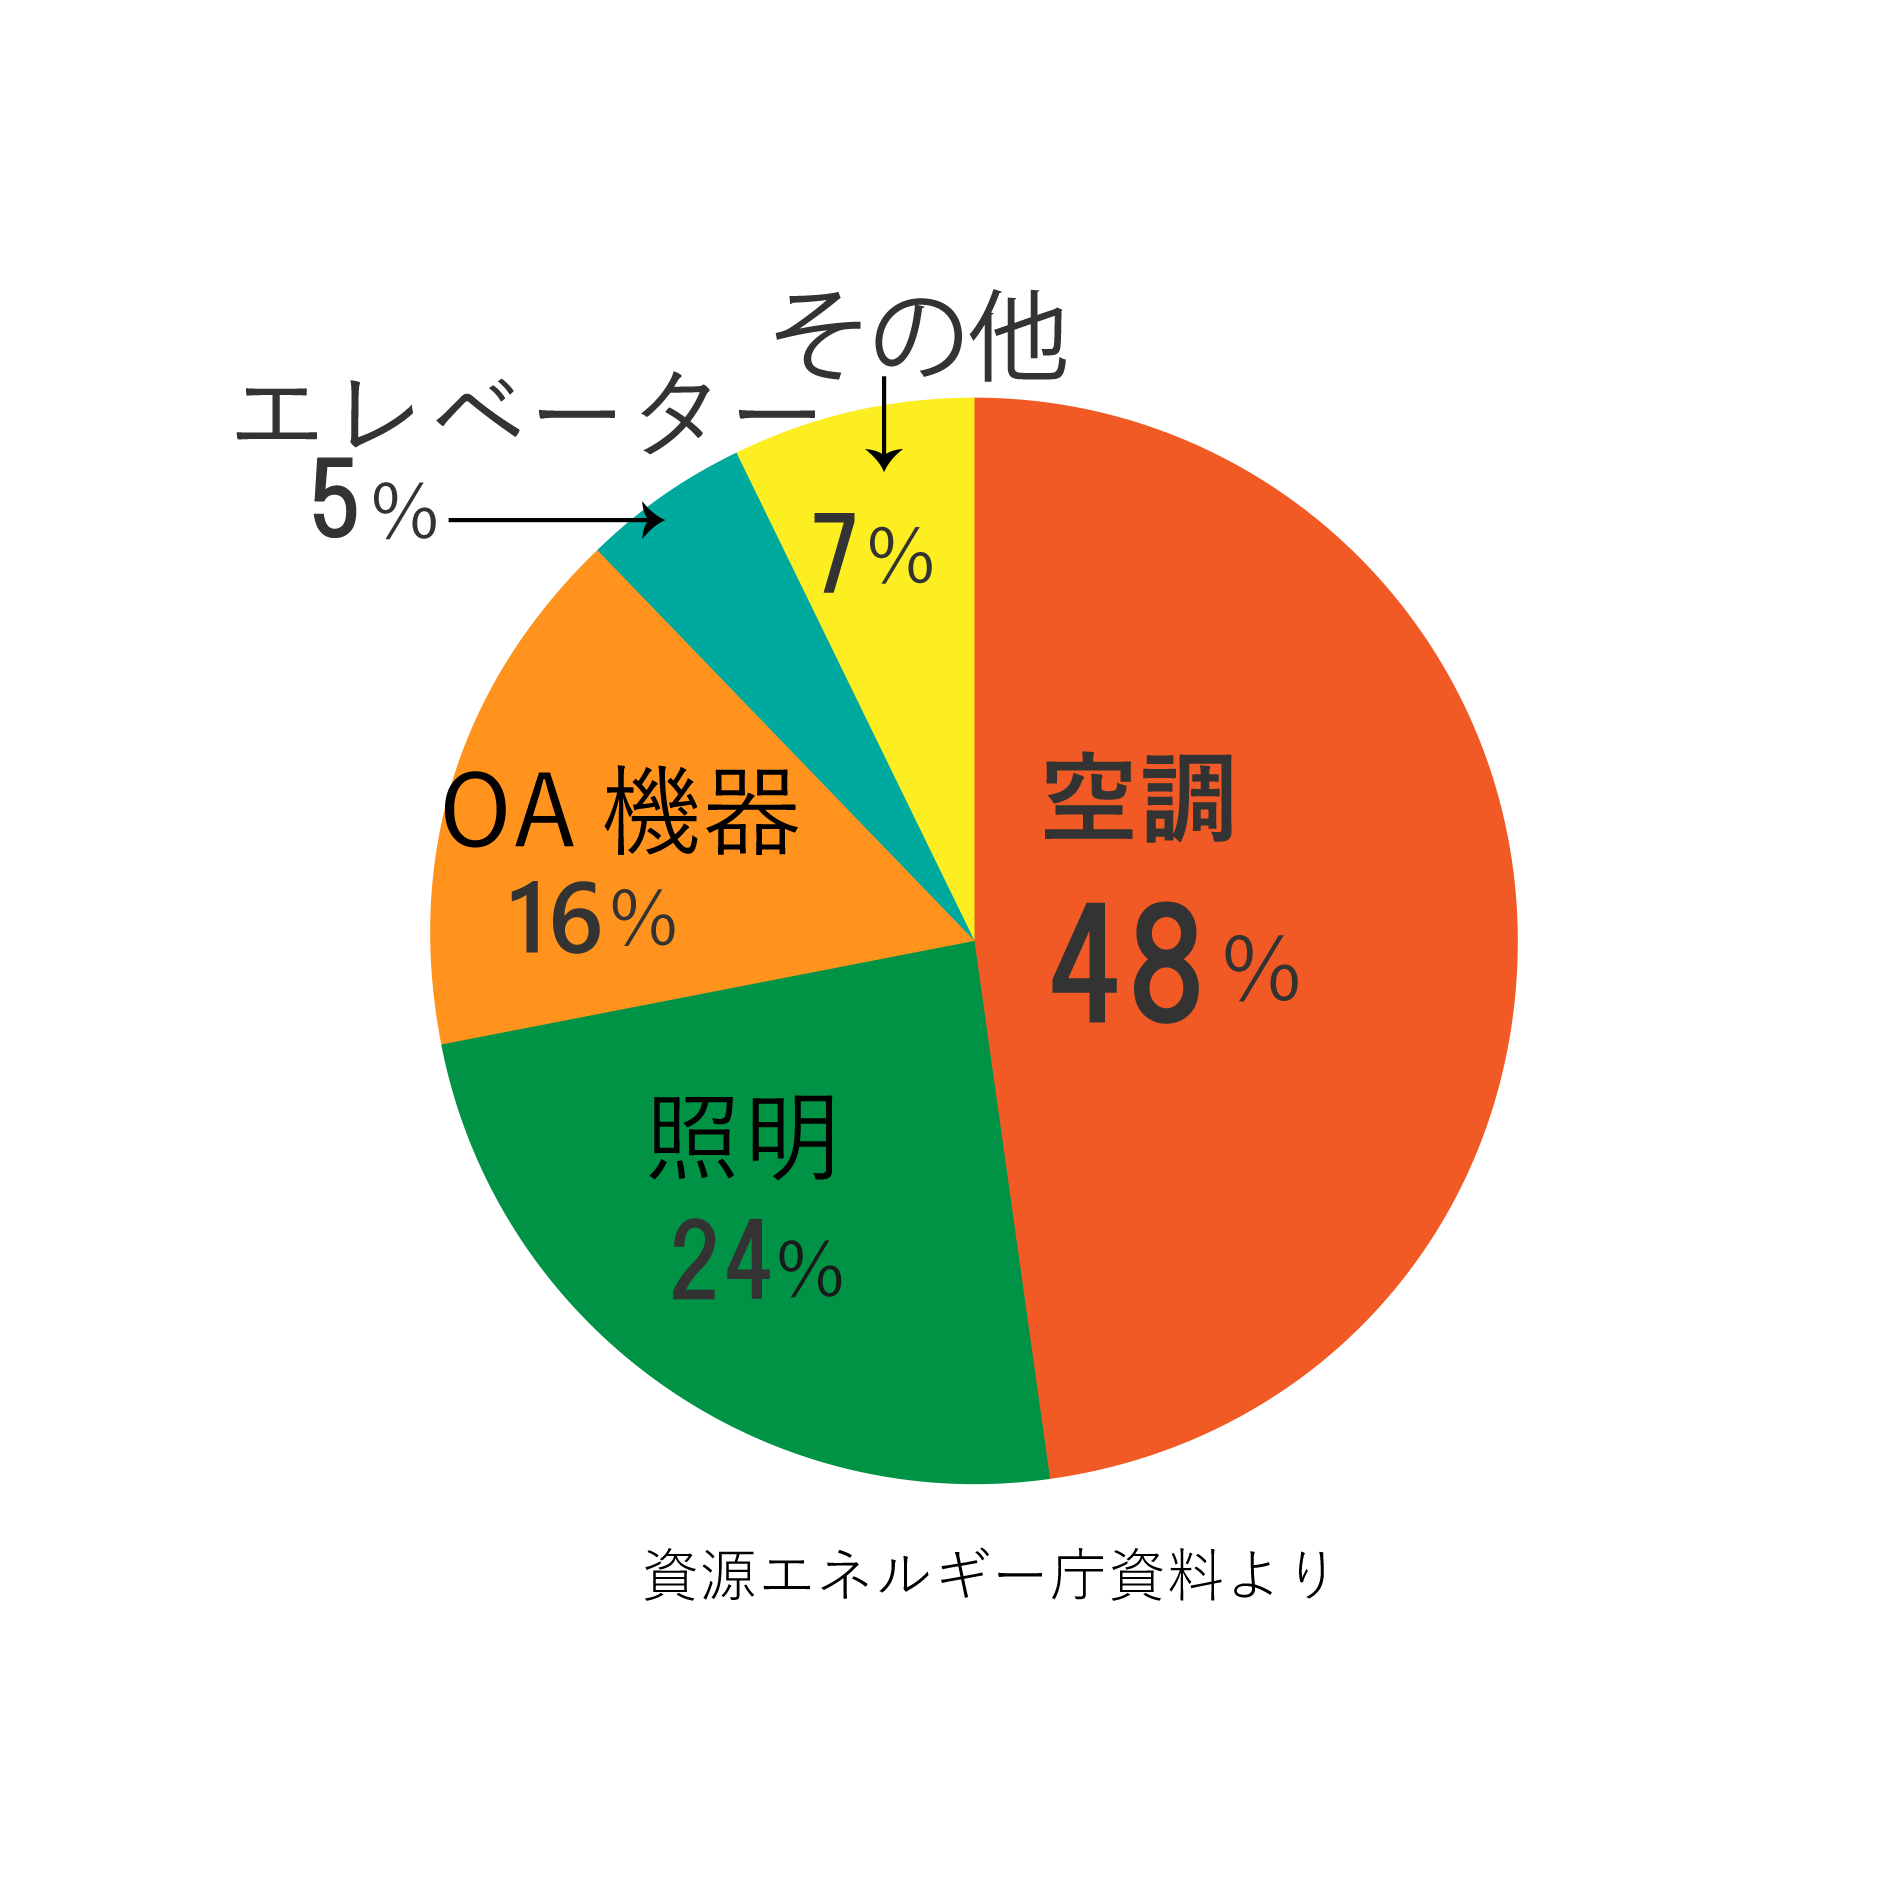
In the average wholesale and retail store, the electric power consumption in the daytime (10:00-18:00)is large, and it in night is about 20 %- 60 % compared with the daytime.And the percentage of the electric power consumption at the time of the peak is as follows that air conditioner is about 48 % and lighting is 26% and freezing refrigeration (refrigerator and showcase) is 9%, and those totals are about 83 % of the whole.
Food center electric power consumption graph
Food center electric power consumption graph
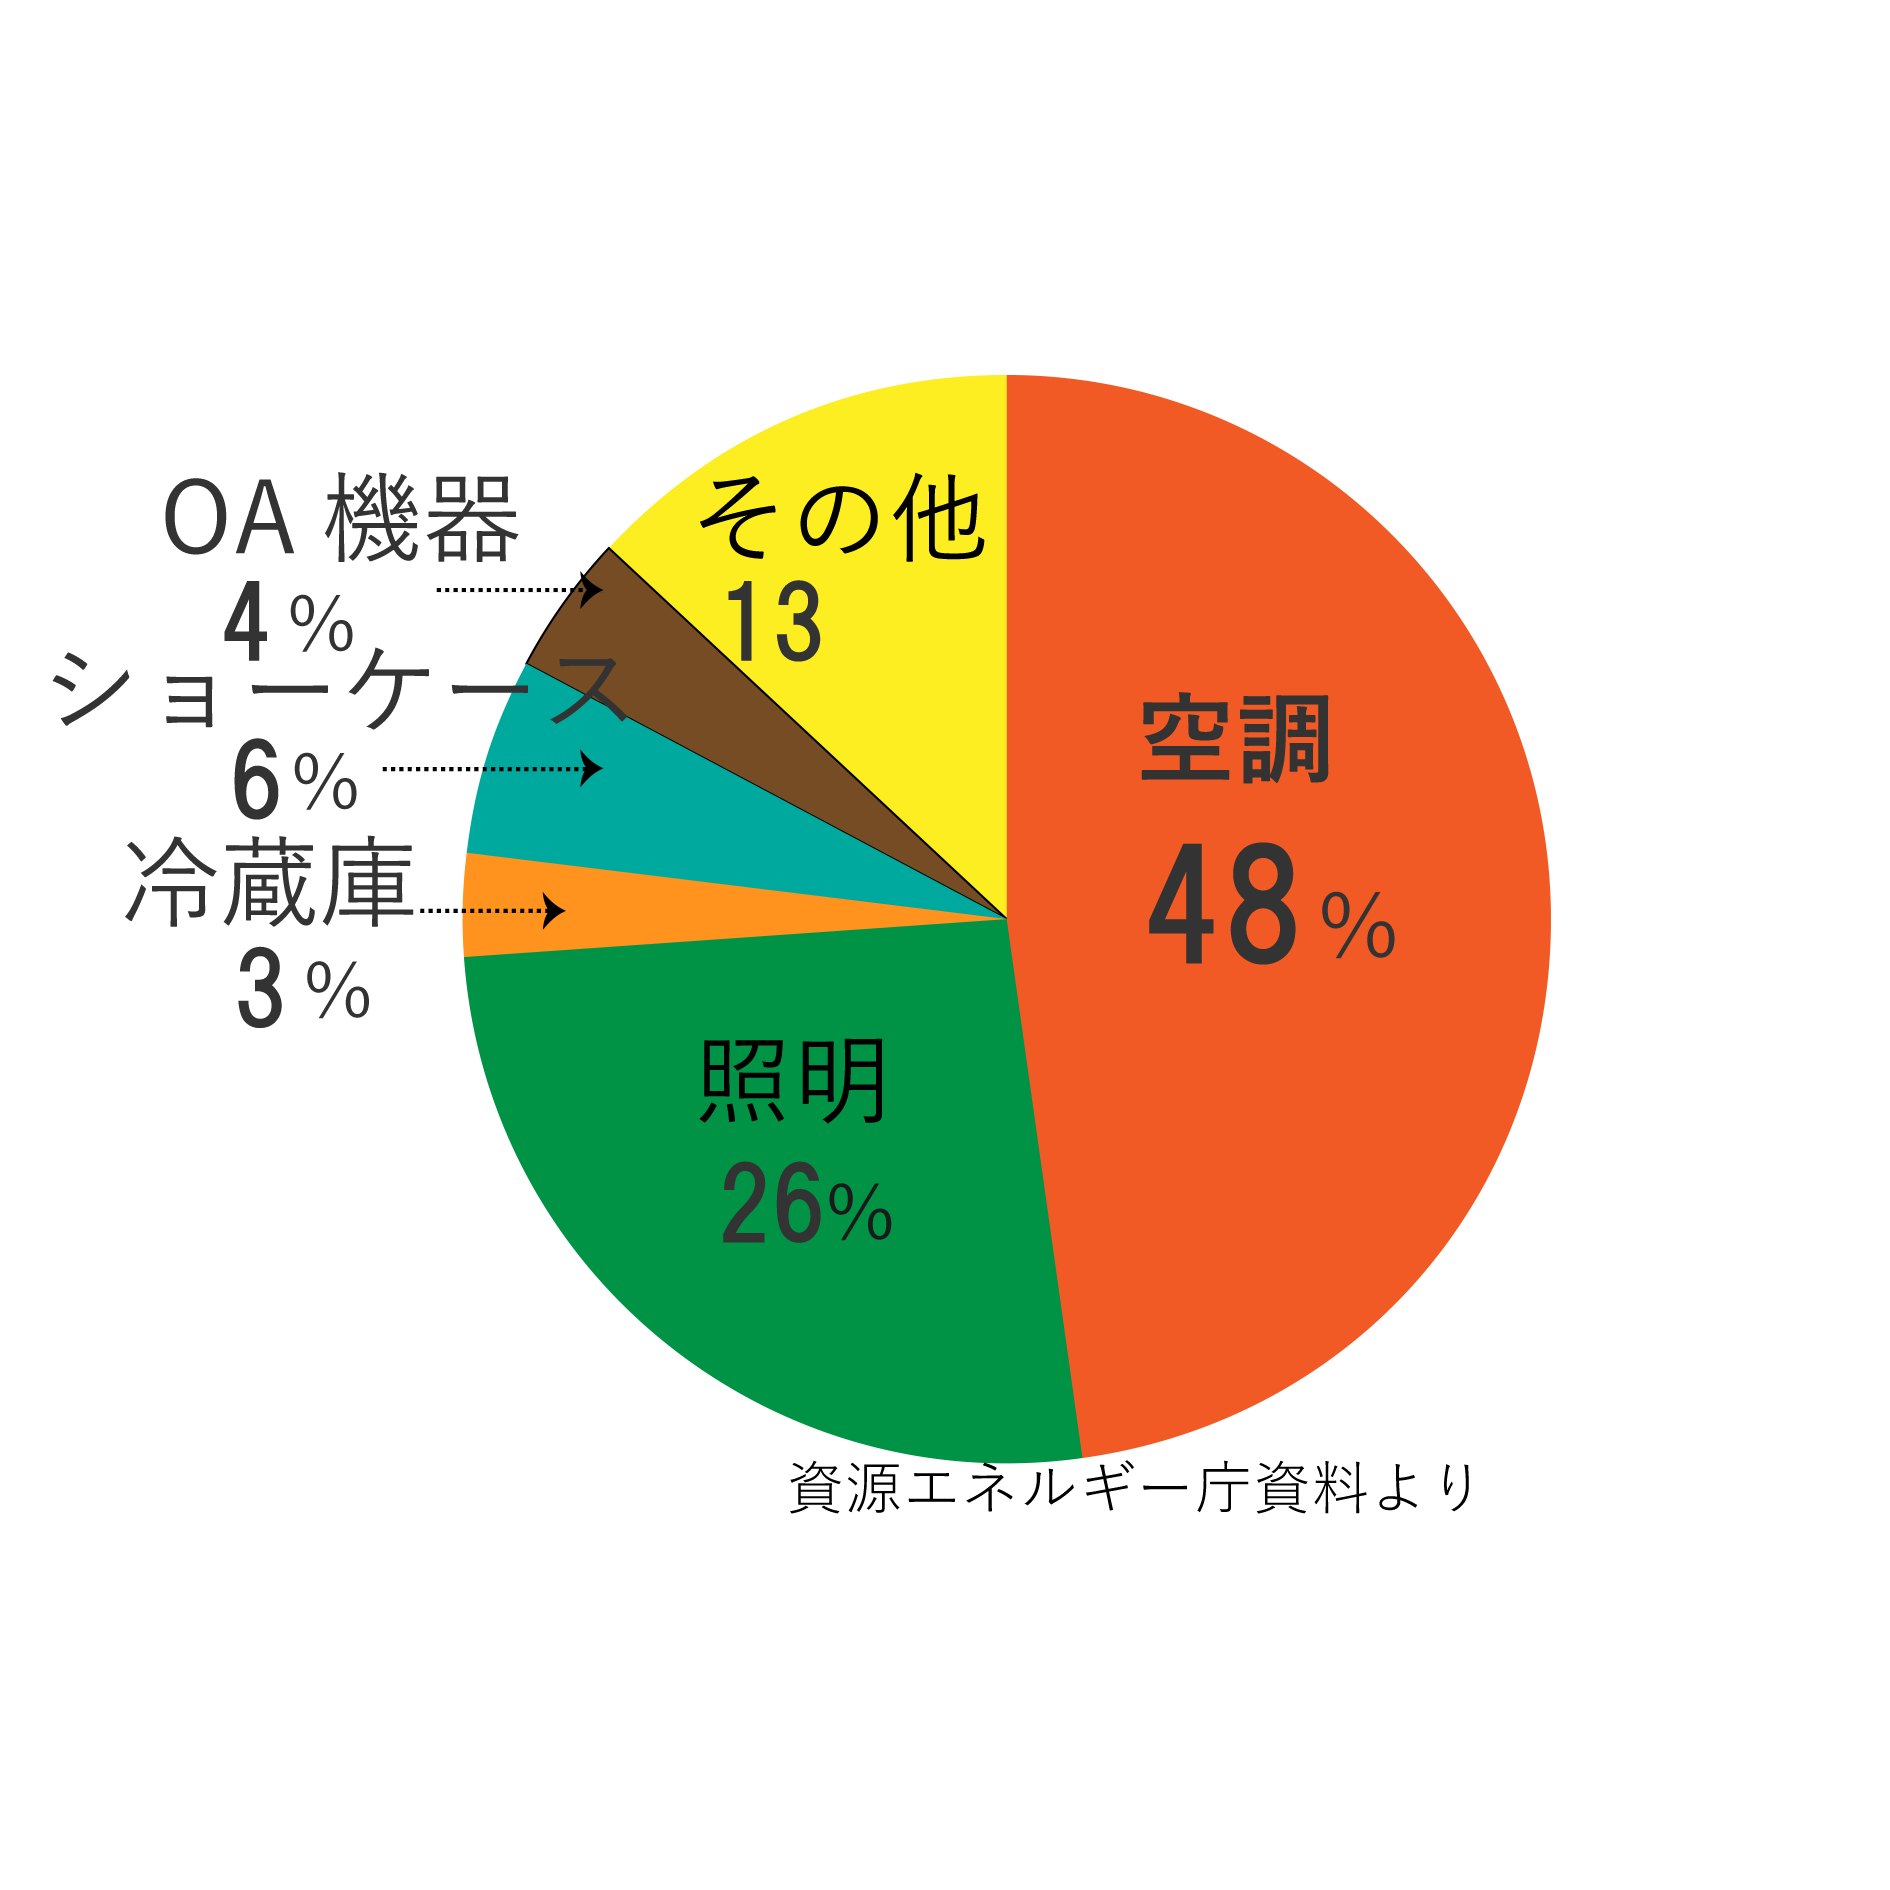
In the average food supermarket, the electric power consumption at daytime (10:00-19:00) is large, and it in night is about 20 %- 80 % compared with the daytime. And the percentage of the electric power consumption at the time of the peak is fllows that freezing refrigeration (refrigerators and showcases, etc.) is about 35 %, and air conditioner is 25% and lighting is 24%, and those totals are about 84 % of the whole.
Hospital welfare electric power consumption graph
Hospital welfare electric power consumption graph
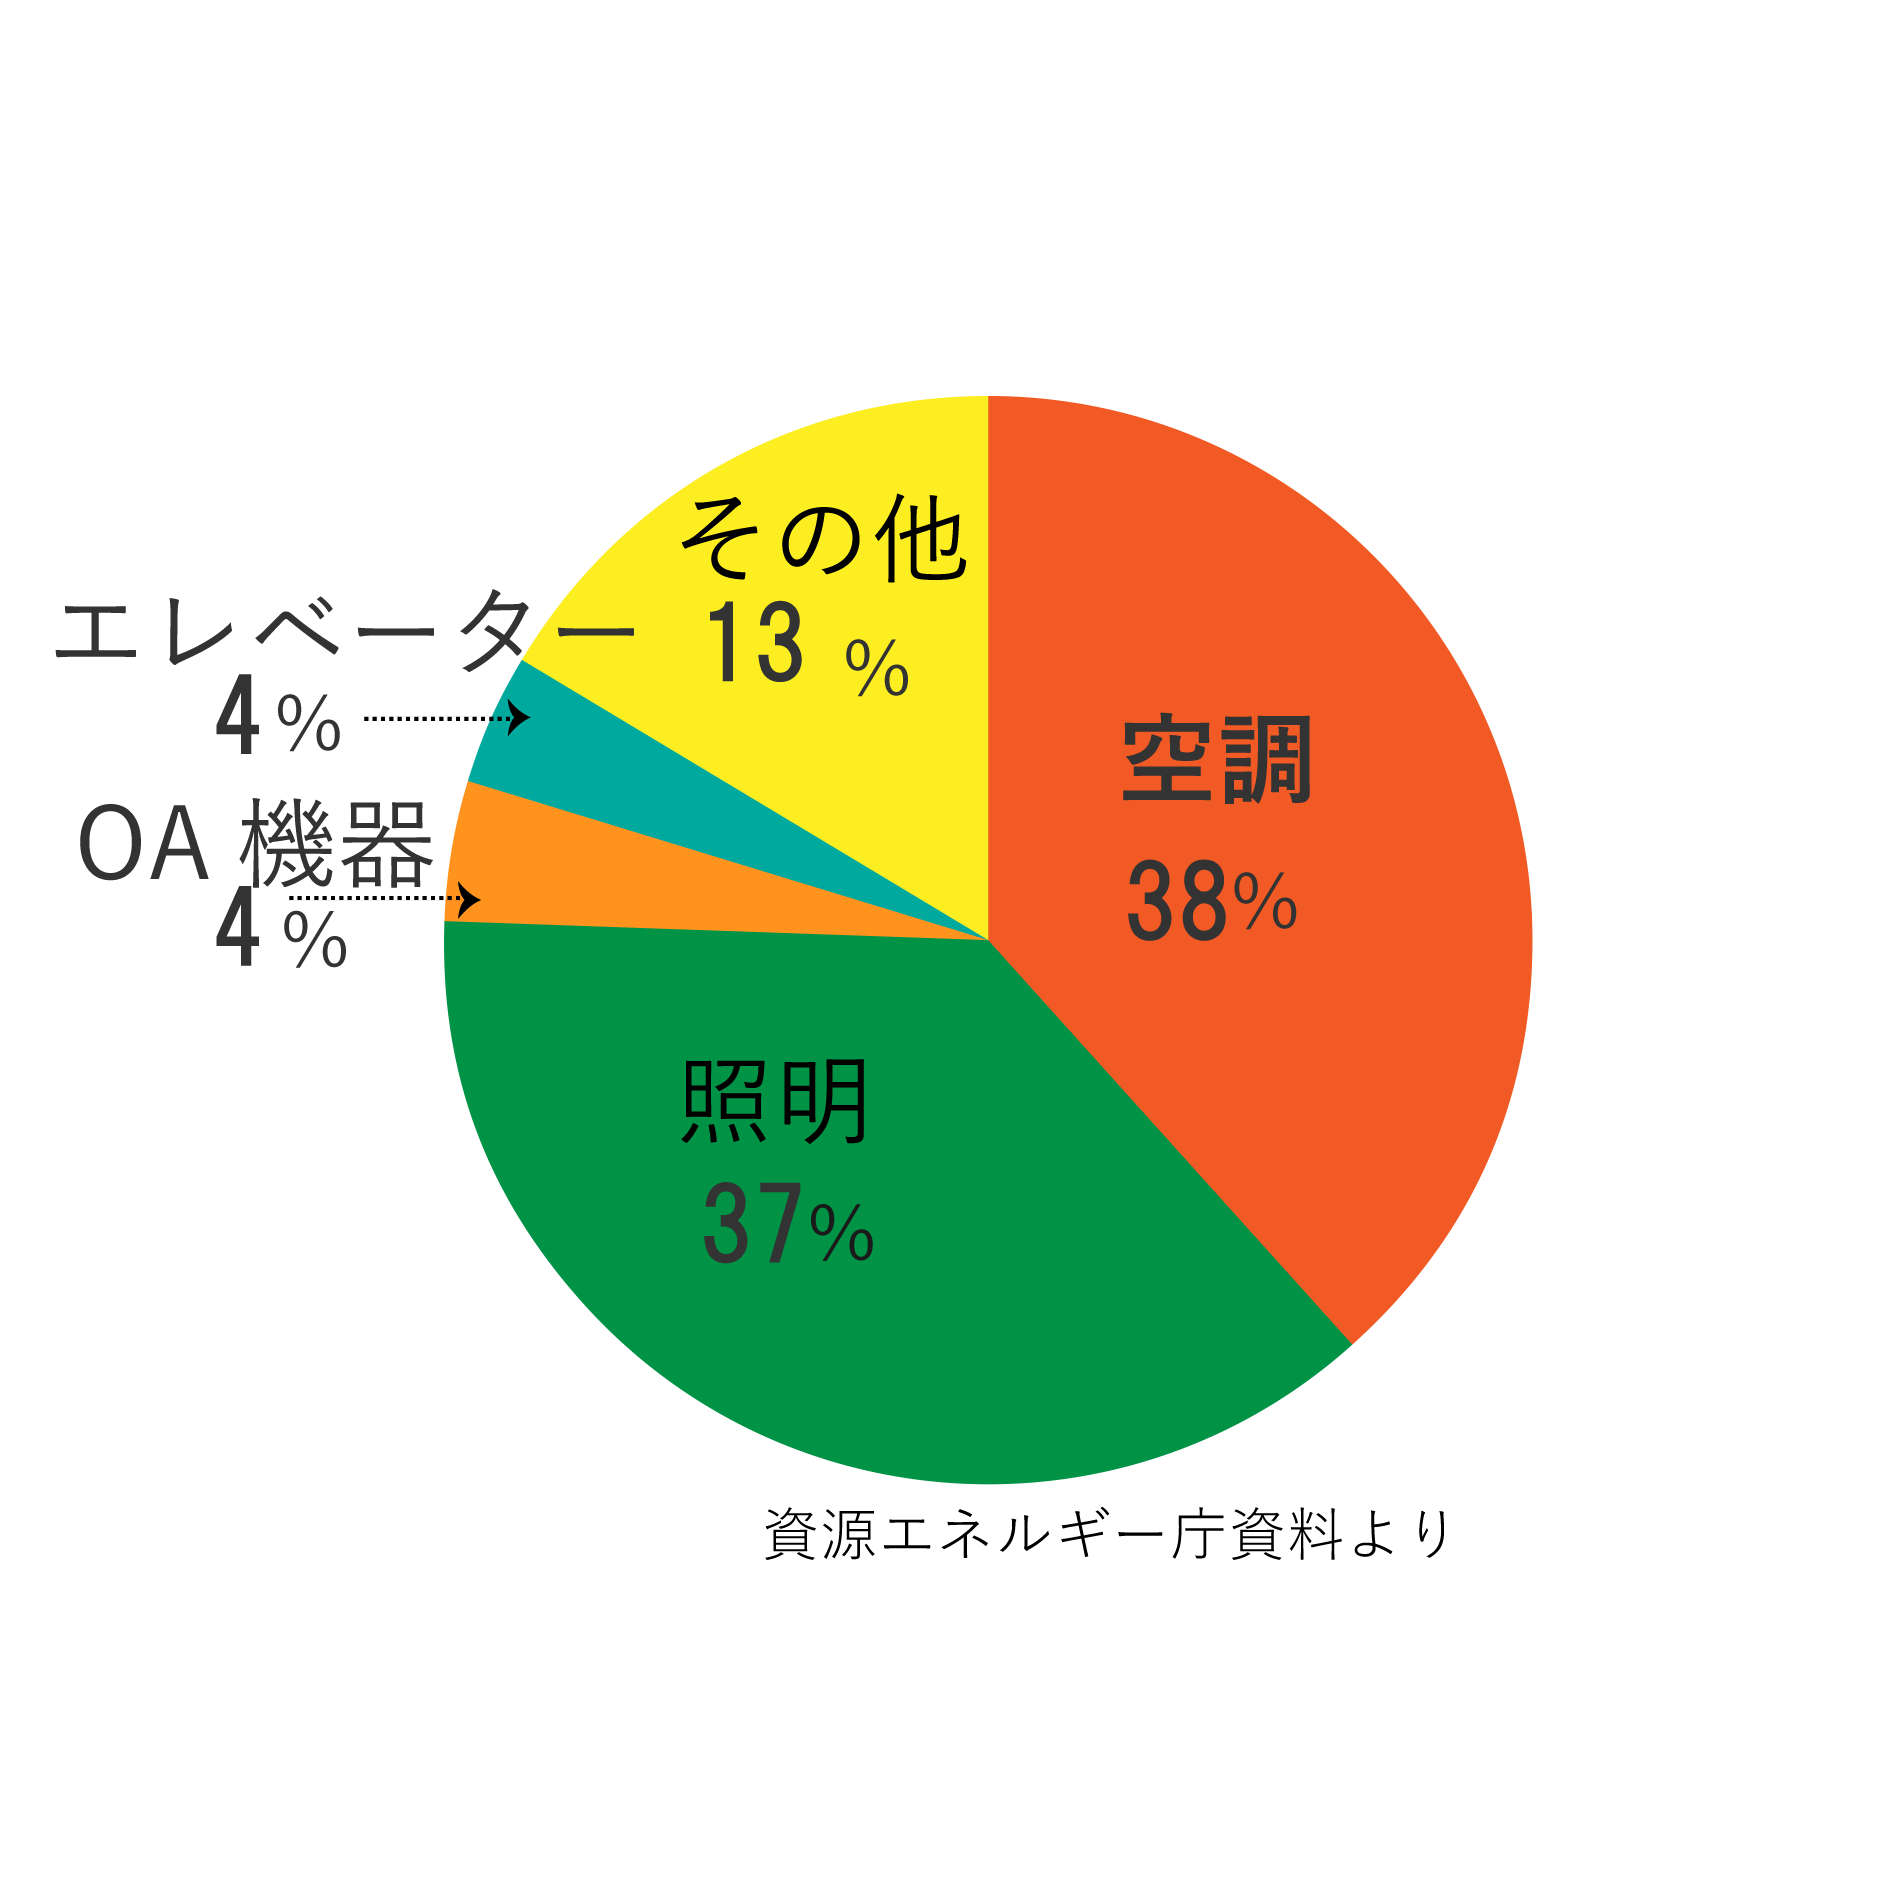
In the average medical agency (hospitals and medical offices, etc.), the electric power consumption in the daytime (8:00-17:00) is large and it in night is about 50-60 % compared with the daytime.And the percentage of the electric power consumption at the time of the peak is as follows that air conditioner is .About 38 % and lighting is about 37 % and thase totals are about 75 % of the whole.
Hotel Japanese-style hotel electric power consumption graph
Hotel Japanese-style hotel electric power consumption graph
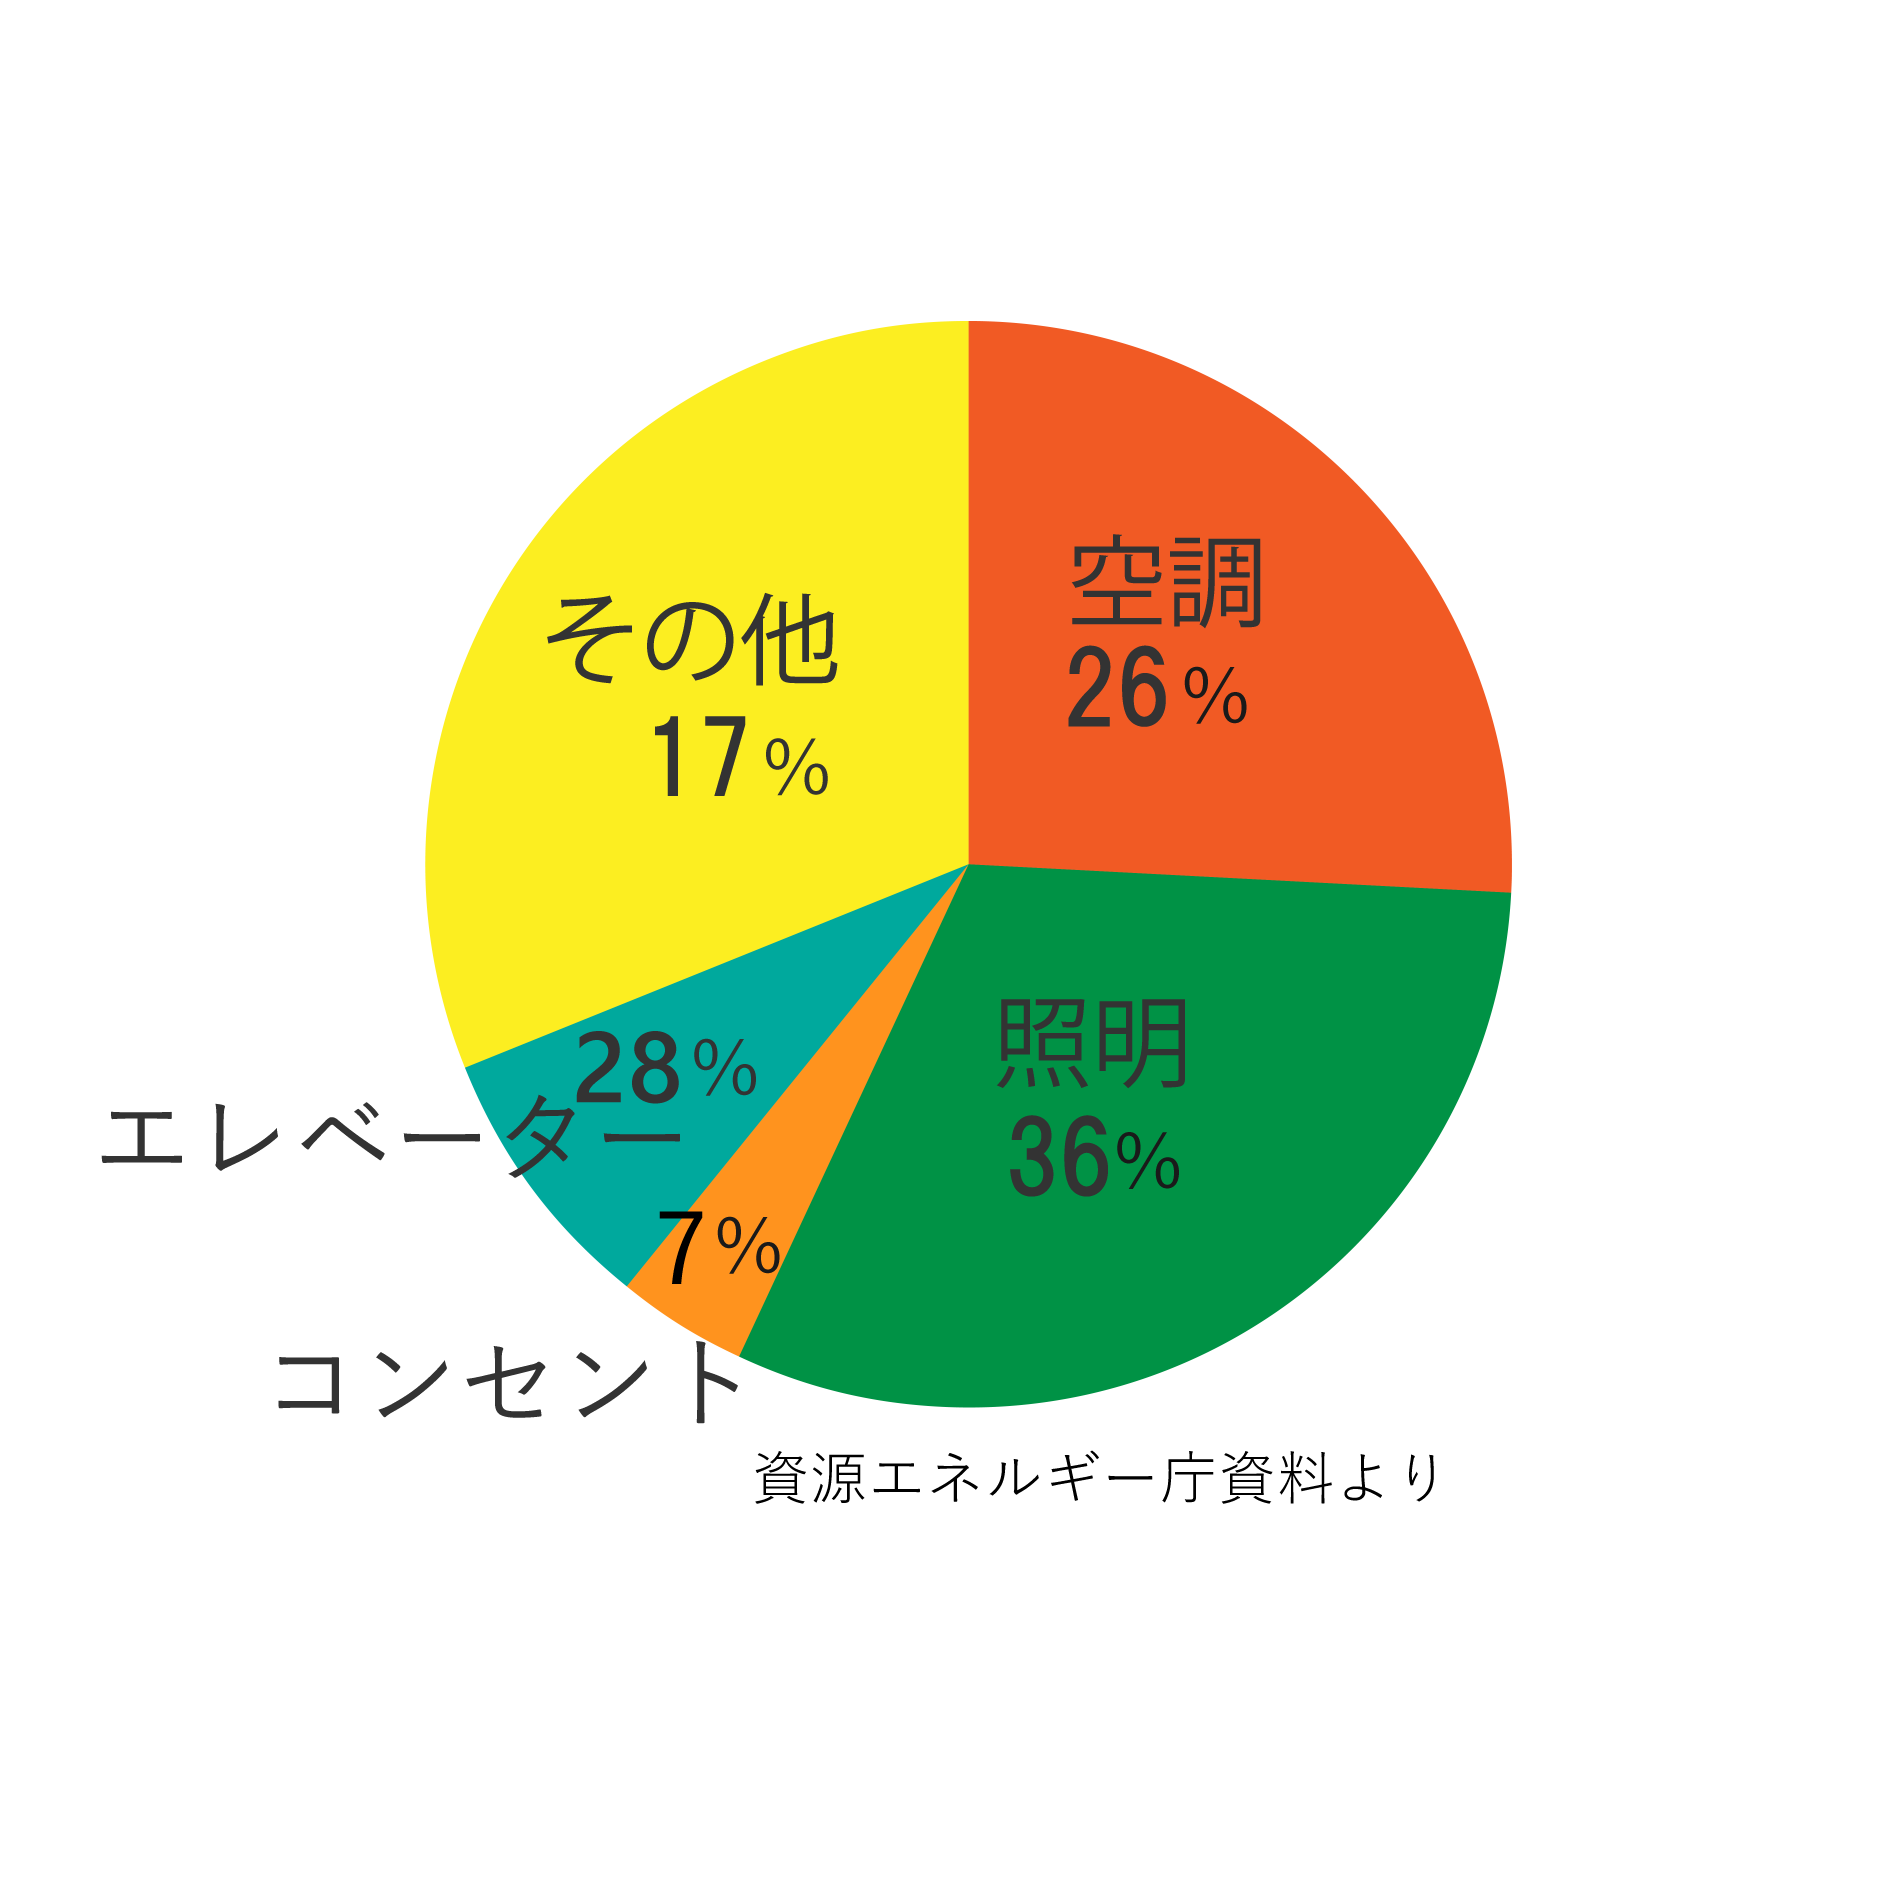
In the average hotel and Japanese-style hotel, the electric power consumption in the daytime (9:00-20:00) is large and it in night is about 40-80 % compared with the daytime.And the percentage of the electric power consumption at the time of the peak is as follows that lighting is 31% and air conditioner is 26%, and those totals are about 57 % of the whole.
Industry electric power consumption graph
Industry electric power consumption graph
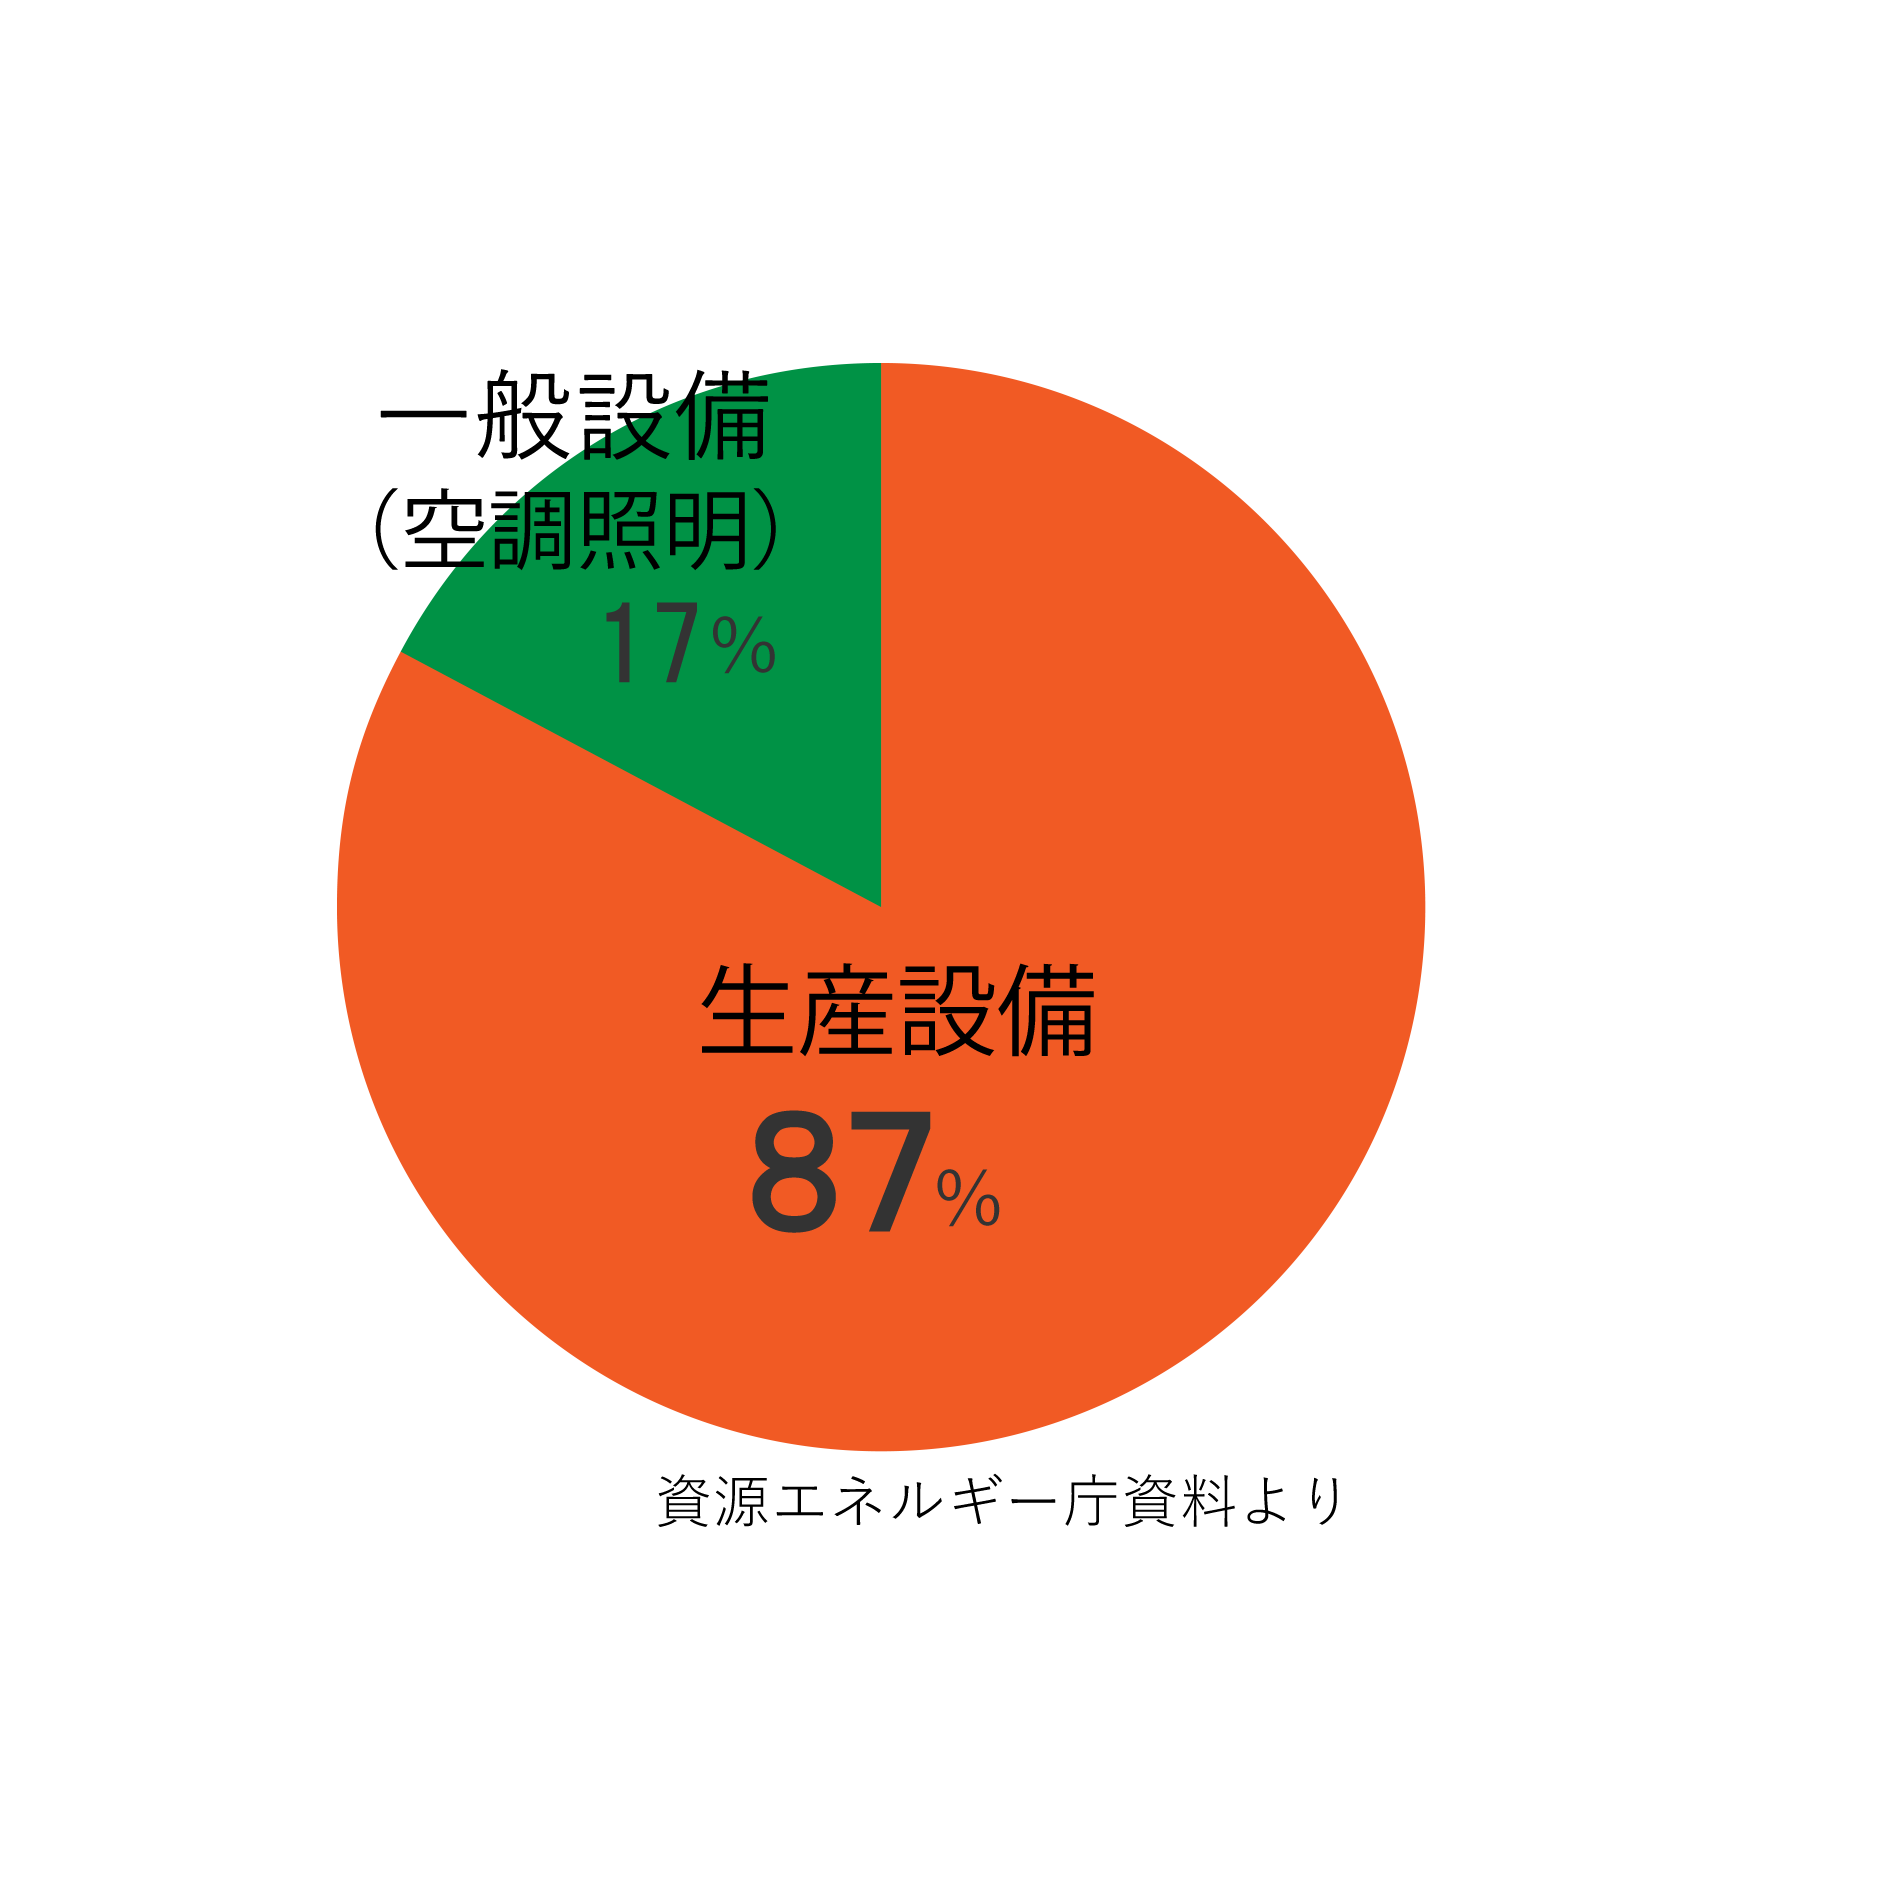
The occupied percentage of the electric power consumption by productive facilities is high. So the brownout measure by the production process is effective in particular.
In the industry, the most important thing is to shift the starting time of each facilities as much as possible at after the vacation or the beginning of the week and it is never start at one time.Whether this is done or it isn’t done, the great difference comes out to the peak demand of the electric power.
General house electric power consumption graph
General house electric power consumption graph
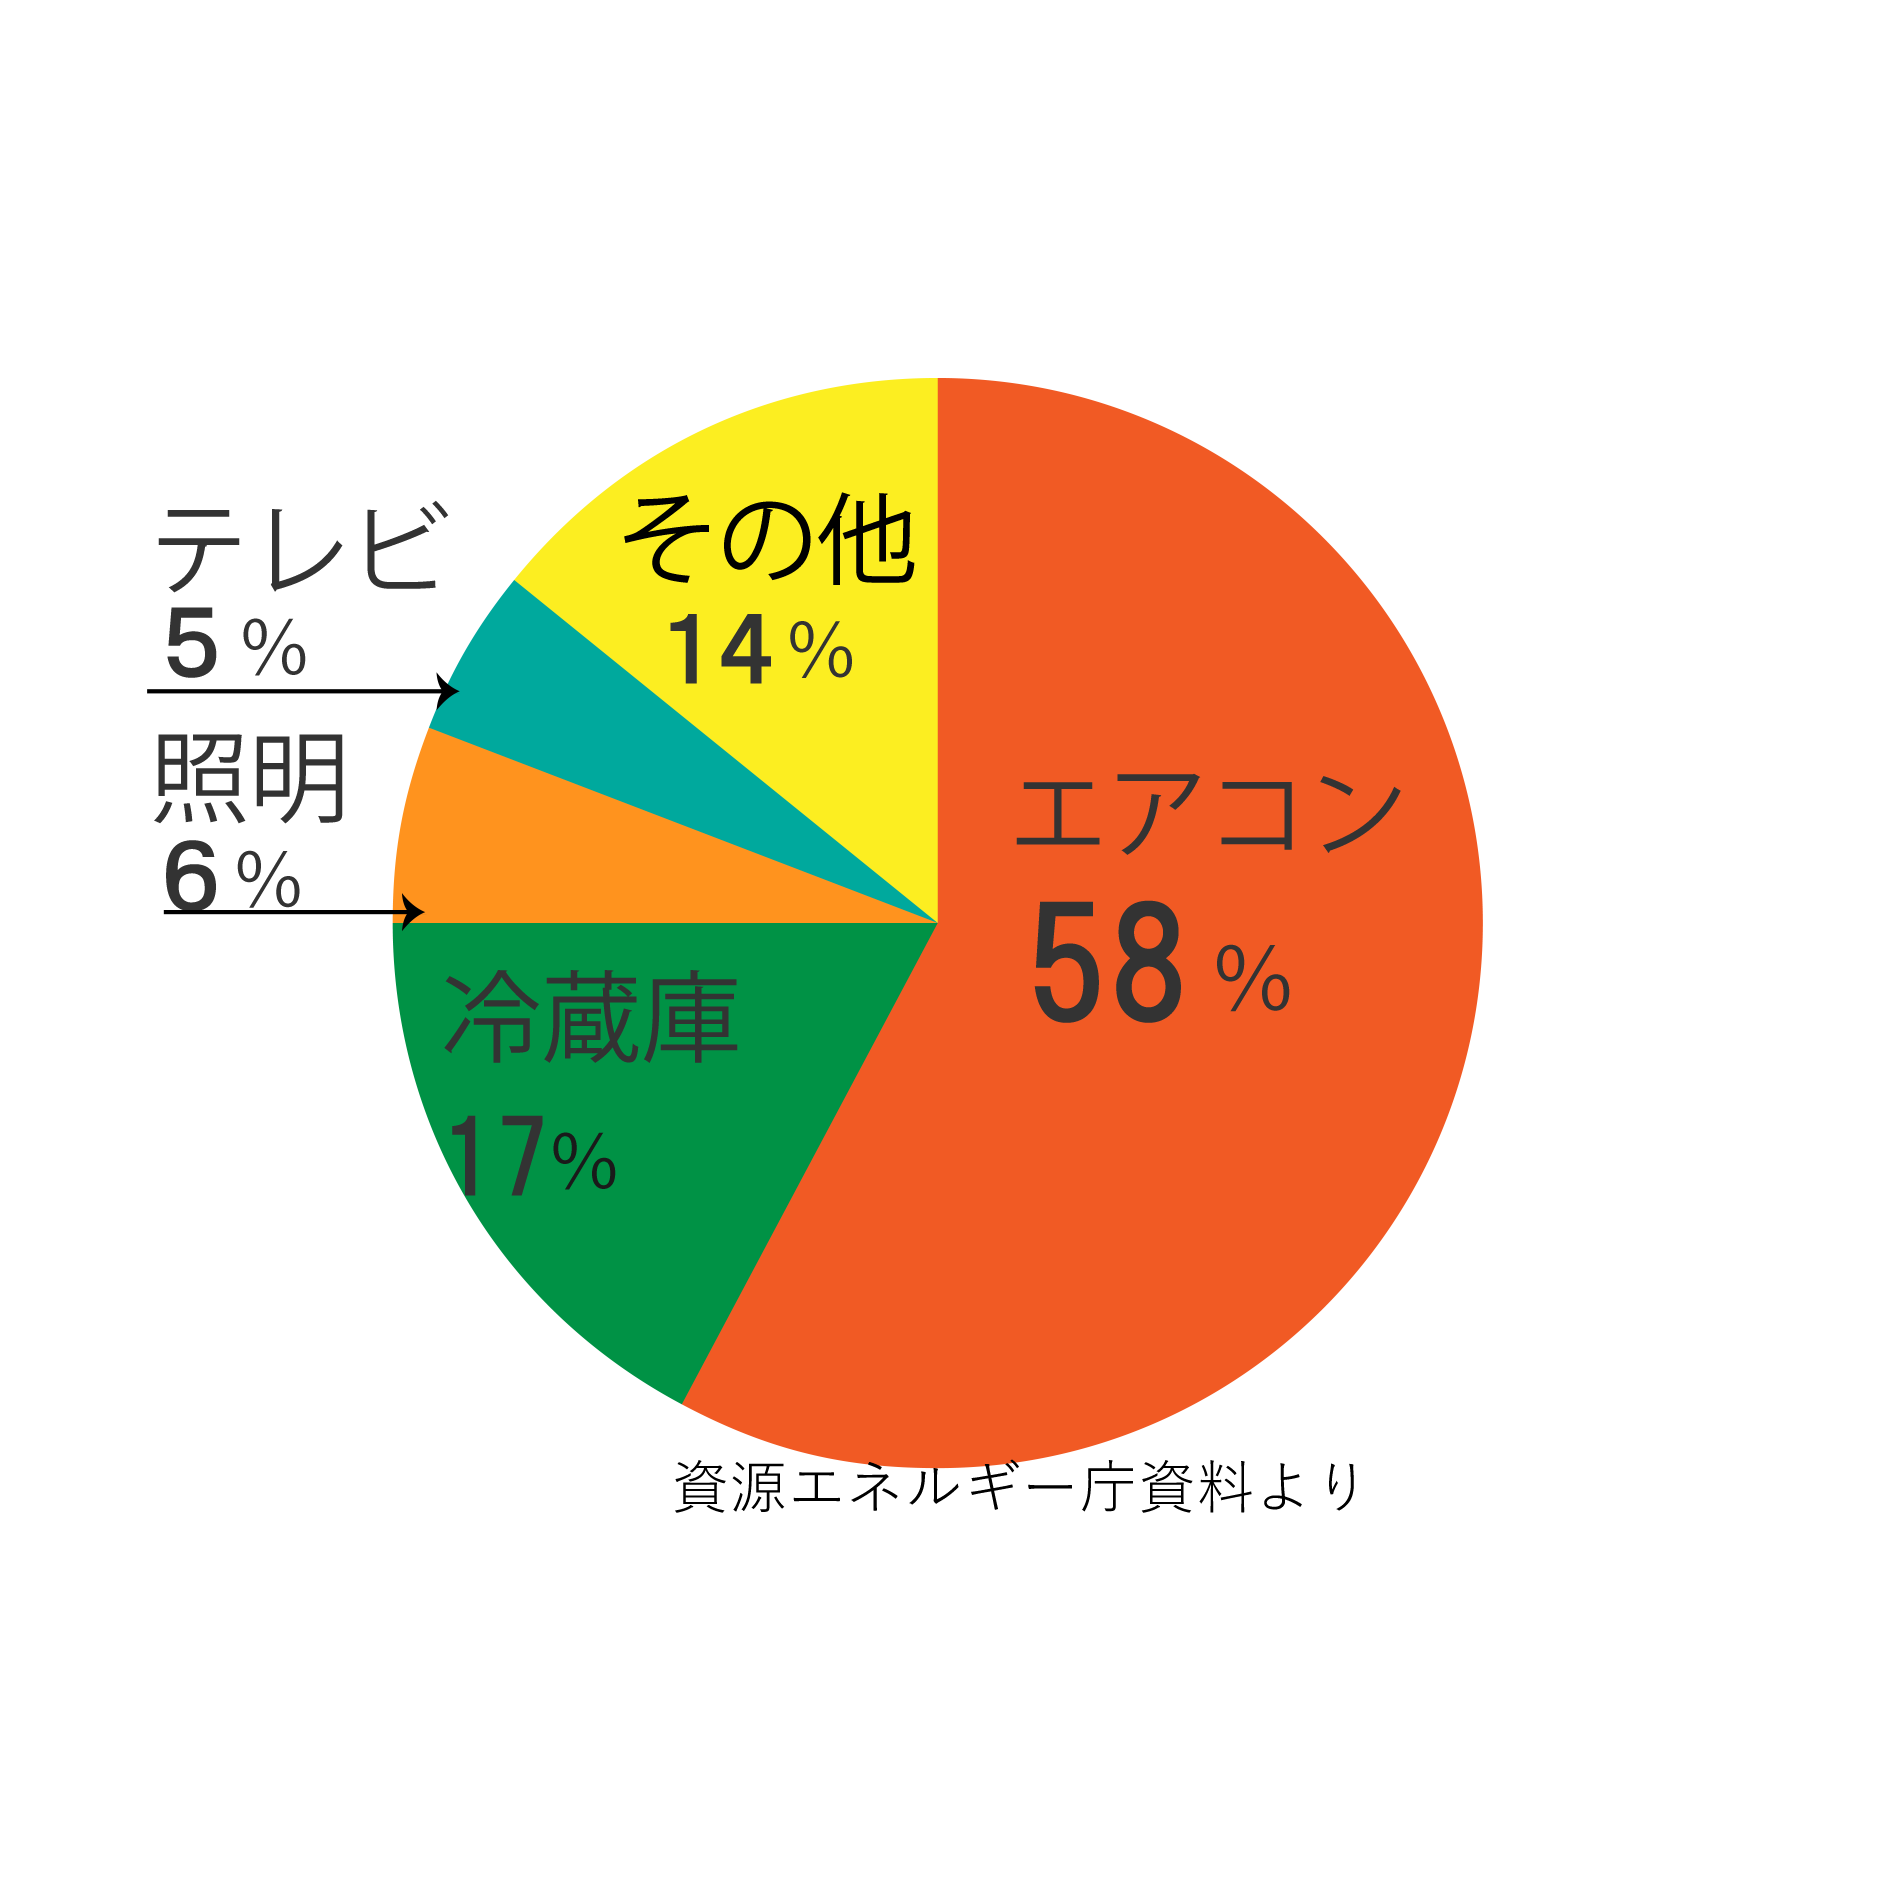
The graph in the general house is also put just in case. Electric visualization is managed by the following graph, so it is put just in case.
Demand monitoring graph
1 minute unit demand change
As seeing by 1 minute unit demand graph above-mentioned, even if the peak of demand in an instant crosses over, it’s no problem by balancing by 30 minute unit
Please refer to the following graph.
Demand change figure
※When seeing as one of goods, electricity is different goods primarily by an electric power at 10:01 and an electric power at 10:02, but an electric power is being handled as 30 minute unit in conditional value in Japan.This is easiness by the meaning to have , but when grasping data only by 30 minute unit conversely, correspondence of electric power management often becomes difficult.
What ia a capacity mechanism and What is a capacity market ?